Key takeaways
- Nominal electricity supply is not the same as deliverable capacity on the required timeline.
- Cooling and water choices must be evaluated with local climate, grid and community conditions.
- A portfolio view can preserve optionality when connection queues and workload requirements are uncertain.
Start with the workload envelope
Site comparison begins with the workload rather than the parcel. Training, inference and mixed enterprise services create different density, latency, availability and expansion requirements.
Leaders should model a range of utilization and technology paths. A site optimized for one hardware generation can become restrictive if density or cooling requirements change.
- Power demand at realistic utilization
- Rack density and cooling range
- Network latency, routes and redundancy
- Availability and recovery objectives
- Expansion timing and modularity
Separate capacity from connection
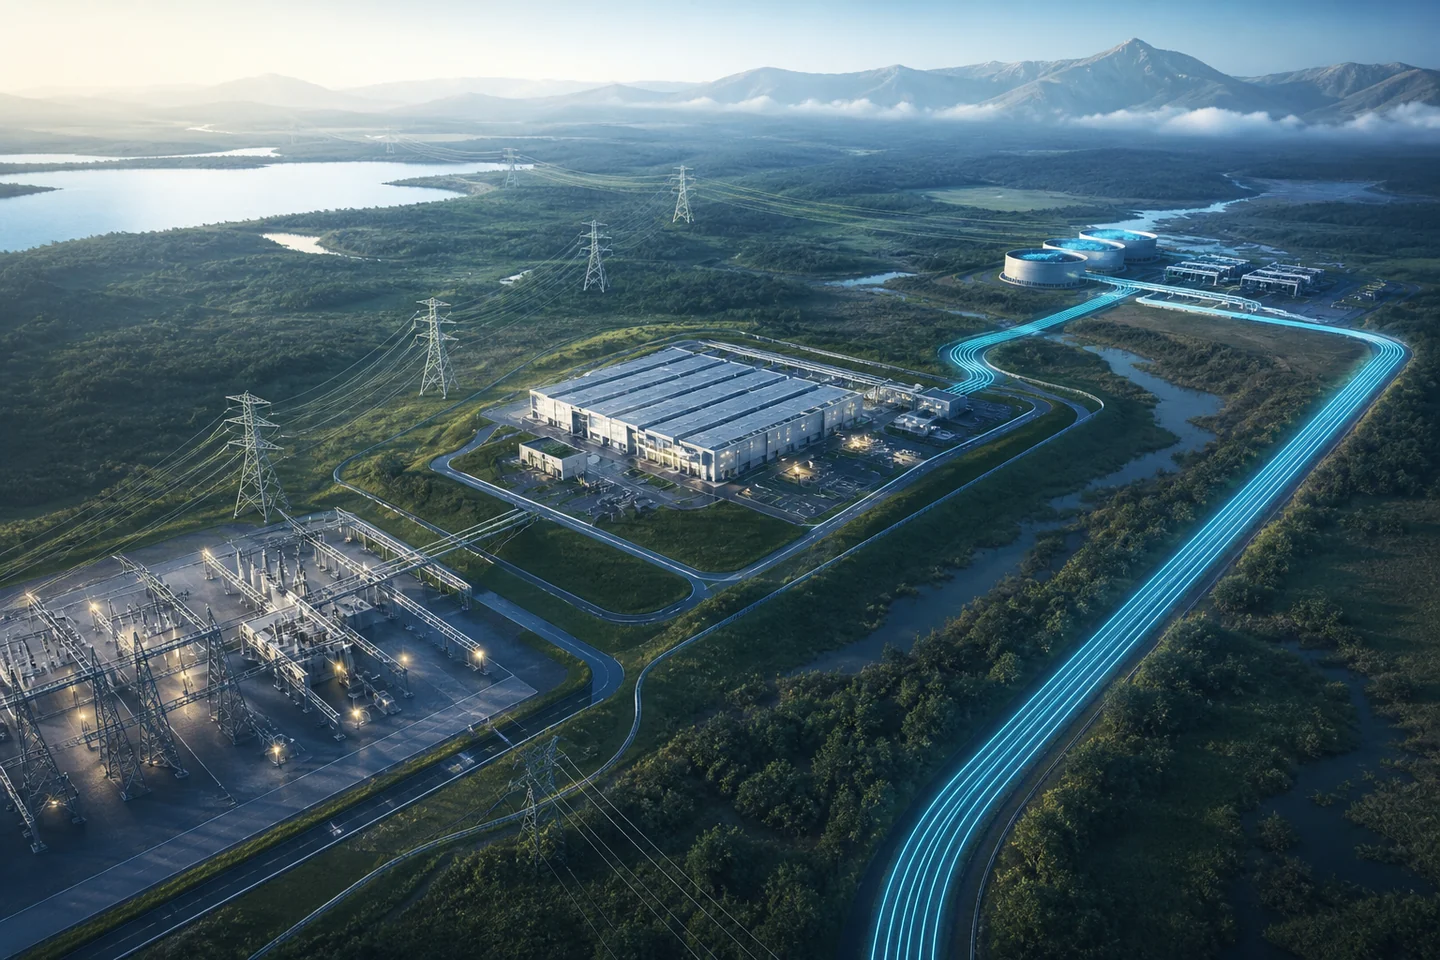
A region can have abundant generation while a specific project waits for grid studies, transmission, substations or equipment. The relevant metric is firm deliverable capacity by phase and date.
Procurement should document who bears delay risk, what interim supply is allowed and whether the energy claim reflects matching supply, additional capacity or only contractual accounting.
- Firm connection milestones
- Substation and equipment dependencies
- Backup generation and fuel constraints
- Price exposure and demand-response options
- Evidence behind renewable or low-carbon claims
Evaluate water and community resilience
Cooling efficiency cannot be separated from water stress, ambient conditions and the local grid. A design that reduces electricity in one climate may increase water dependence in another.
Community acceptance and permitting are operating variables. Transparent scenarios for water, noise, land, construction and local benefit reduce the risk that an apparently attractive site becomes unavailable or constrained.
- Water source, stress and seasonal availability
- Heat-reuse or dry-cooling opportunities
- Noise and construction impact
- Local emergency and infrastructure coordination
- Public reporting that can be verified over time
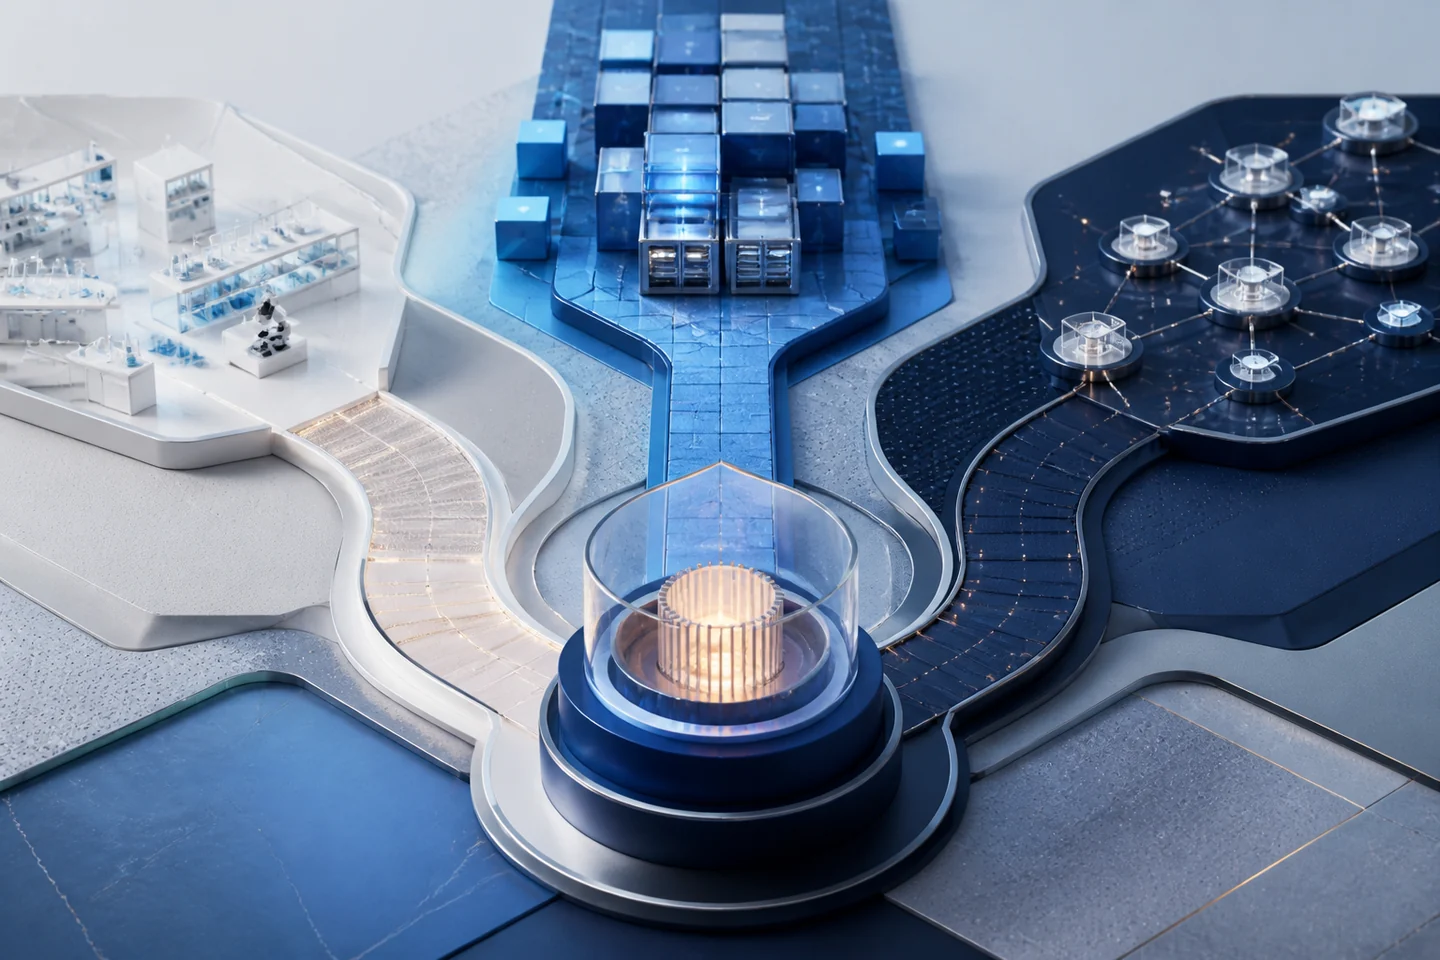
Model the site as a sequence of capacity options
A single ultimate-capacity number hides the risk in delivery. The site model should show when each power block, cooling loop, network route and building module can be commissioned, what dependency controls that date and how much capital is exposed before certainty improves. This makes delay risk comparable across locations.
Optionality can be designed through phased land, standardized modules, reserved interconnection capacity and a portfolio of regions with different latency and regulatory profiles. The most valuable site may be the one that preserves several credible expansion paths rather than the one with the lowest first-phase unit cost.
- Capacity by date and confidence
- Critical equipment lead times
- Capital at risk before connection
- Alternative site or workload route
Audit the sustainability claim at system level
Power-usage effectiveness is useful but incomplete: it does not show whether clean supply is available at the same time as demand, whether water is scarce or whether a facility adds stress to a constrained grid. Buyers should track energy, emissions, water and reliability with transparent boundaries and hourly or seasonal context where material.
The operating review should also capture how workload flexibility changes the infrastructure requirement. Some batch workloads can move in time or location; latency-sensitive services cannot. Treating flexibility as a designed product property can reduce the need for expensive peak capacity without making availability promises that the service cannot keep.
- Time-matched energy evidence
- Water withdrawal and consumption
- Grid and community impact
- Workload-specific flexibility limits
Evidence ledger
Infrastructure planning based on IEA energy-system analysis. Forecasts are presented as scenarios, not certainties; local grid, water and permitting evidence must be verified for each site.
IEA scenario work projects rapid growth in electricity used by data centres while emphasizing uncertainty in AI adoption, hardware and efficiency.
The supply challenge includes generation, networks and the timing and location of deliverable power, not generation volume alone.