Key takeaways
- Calculate cost per successful unit, not cost per hour of theoretical operation.
- Integration and intervention frequency can dominate hardware depreciation.
- The best first deployment creates a reusable operating pattern for the next one.
Model the complete operating loop
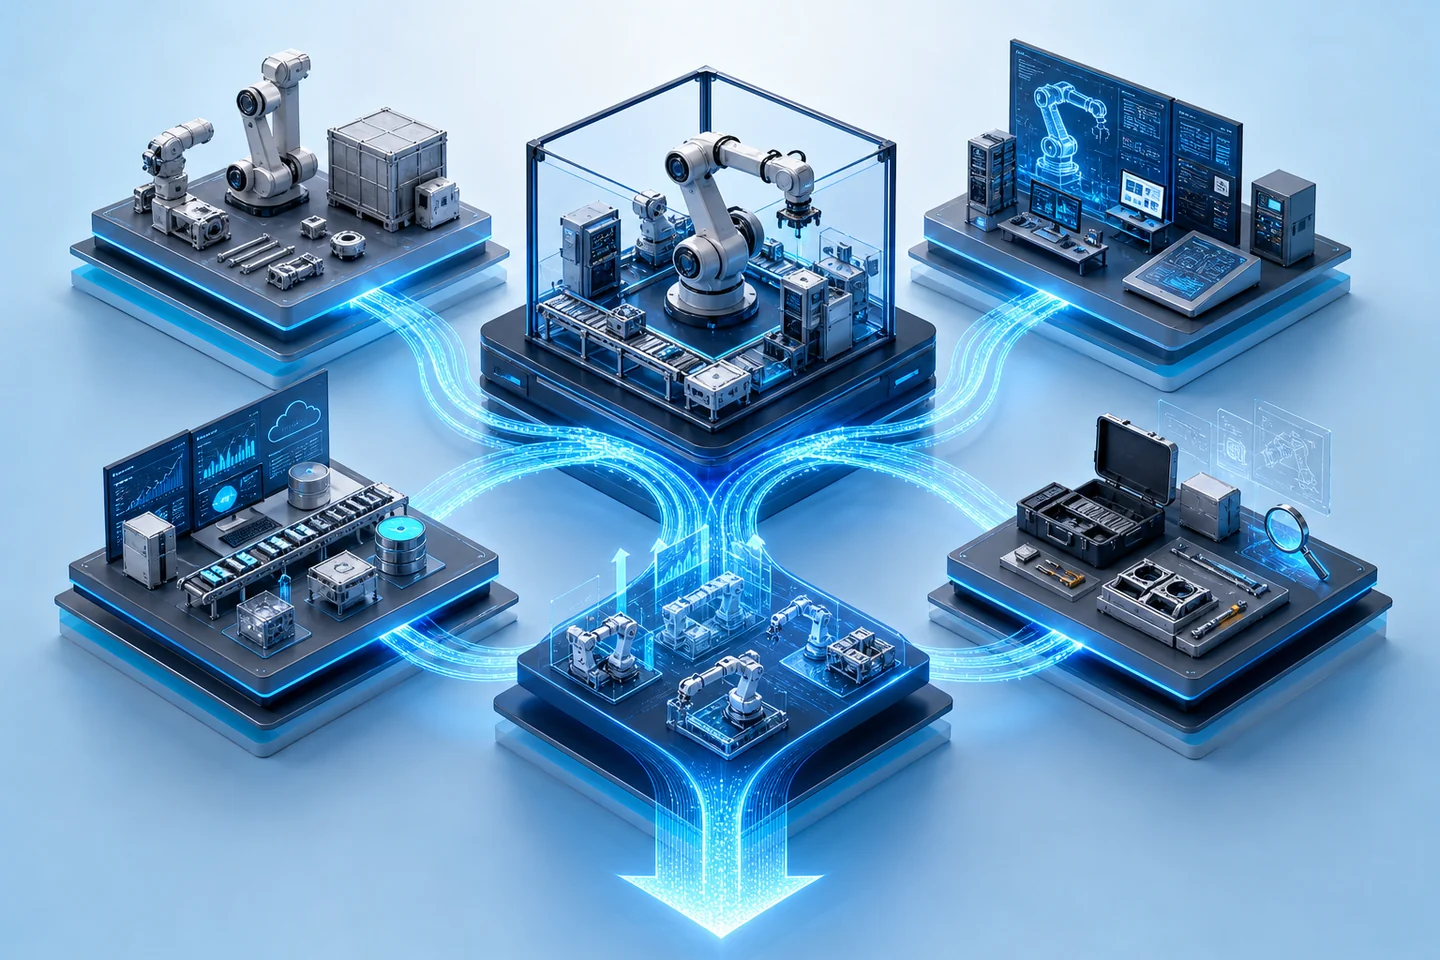
A robot does not create value in isolation. It depends on fixtures, perception, safety systems, software, maintenance and a process for exceptions. The economic model must include that complete loop and the volume of successful work it produces.
Use five cost buckets
A comparable total-cost model prevents a visually impressive demo from hiding operational friction. It also makes different automation approaches easier to compare over the same task horizon.
- Acquisition: robot, end effectors, sensors and safety equipment.
- Integration: engineering, data, layout changes and commissioning.
- Operation: energy, consumables, software and routine labor.
- Exceptions: resets, failed picks, damage, downtime and supervision.
- Change: retraining, new products, line reconfiguration and eventual replacement.
Value the learning asset
The first cell can be worthwhile even before it reaches the target payback if it standardizes interfaces, safety patterns and maintenance skills for a broader program. That learning value should be explicit rather than used as a vague justification for weak economics.
A credible investment case shows both the standalone return and the reusable capability created for future deployments.
Normalize the comparison around accepted output
Compare automation with the current and redesigned manual process using the same demand, quality, operating hours and service level. Accepted output excludes rework and rejects. Labor in the automated case includes replenishment, quality review, exception recovery, maintenance and technical support rather than assuming unattended operation.
The model should report a range. Volume, intervention frequency, changeover time, utilization and discount rate often matter more than a small difference in hardware price. Showing the break-even value for each variable tells the operating team what the pilot must measure.
- Accepted units per available hour
- Interventions and mean recovery time
- Changeover loss by product mix
- Quality, safety and downtime cost
Add a replication factor before calling the pilot scalable
A first cell often receives exceptional engineering attention. The scale model should separate one-time platform work from site-specific work and estimate how integration hours, training, spare parts and support change for the tenth installation. Standards and reusable interfaces create value when that curve improves.
A scale gate can require stable performance across representative shifts, a documented exception catalogue, available technicians, validated safety changes and a target commissioning time for the next cell. This protects the program from extrapolating demonstration economics across a fleet.
Evidence ledger
A task-level economics framework informed by sector statistics and ISO industrial-robot safety context. Payback depends on the site, process and alternative; no generic ROI figure is assumed.
IFR statistics describe robot adoption at sector level but do not determine the payback of a specific task or cell.
Industrial robot safety covers both robot design and integration of the application, so safety and commissioning belong in total cost.